RightMark Audio Analyzer test report
| Testing device | Yamaha Steinberg FW WDM Audio 16-bit, 44 kHz |
| Sampling mode | 16-bit, 44 kHz |
| Interface | |
| Testing chain | External loopback (line-out - line-in) |
| RMAA Version | 6.2.3 |
| 20 Hz - 20 kHz filter | ON |
| Normalize amplitude | ON |
| Level change | 0.7 dB / 0.7 dB |
| Mono mode | OFF |
| Calibration singal, Hz | 1000 |
| Polarity | inverted/inverted |
Summary
| Frequency response (from 40 Hz to 15 kHz), dB | +0.03, -0.11 |
Excellent |
| Noise level, dB (A) | -95.5 |
Excellent |
| Dynamic range, dB (A) | 96.4 |
Excellent |
| THD, % | 0.0016 |
Excellent |
| THD + Noise, dB (A) | -88.2 |
Good |
| IMD + Noise, % | 0.0049 |
Excellent |
| Stereo crosstalk, dB | -97.2 |
Excellent |
| IMD at 10 kHz, % | 0.011 |
Very good |
| General performance | Excellent |
Frequency response
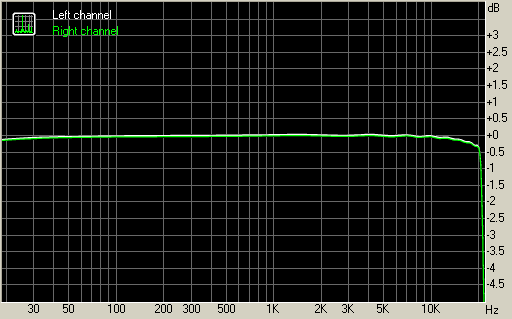
| From 20 Hz to 20 kHz, dB | -0.30, +0.03 |
| From 40 Hz to 15 kHz, dB | -0.11, +0.03 |
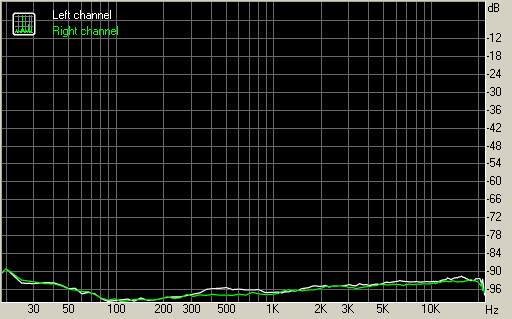
Noise level
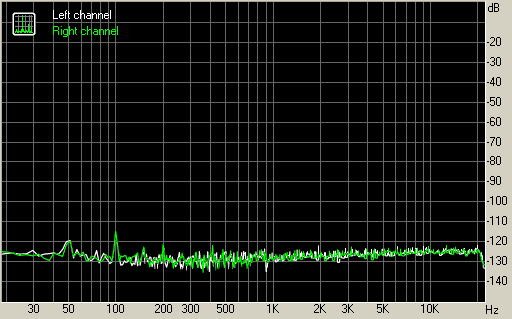
Left |
Right |
|
| RMS power, dB | -94.4 |
-94.5 |
| RMS power (A-weighted), dB | -95.5 |
-95.6 |
| Peak level, dB FS | -80.4 |
-82.8 |
| DC offset, % | -0.0 |
-0.0 |
Dynamic range
Left |
Right |
|
| Dynamic range, dB | +95.2 |
+95.3 |
| Dynamic range (A-weighted), dB | +96.3 |
+96.4 |
| DC offset, % | -0.00 |
-0.00 |
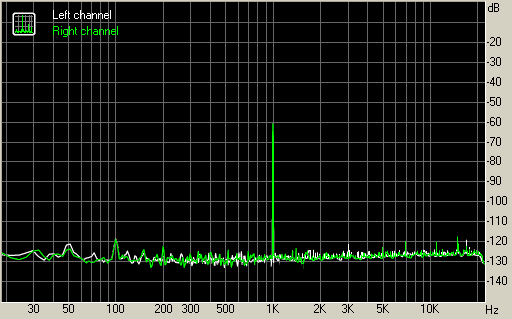
THD + Noise (at -3 dB FS)
Left |
Right |
|
| THD, % | +0.0015 |
+0.0016 |
| THD + Noise, % | +0.0041 |
+0.0040 |
| THD + Noise (A-weighted), % | +0.0039 |
+0.0039 |
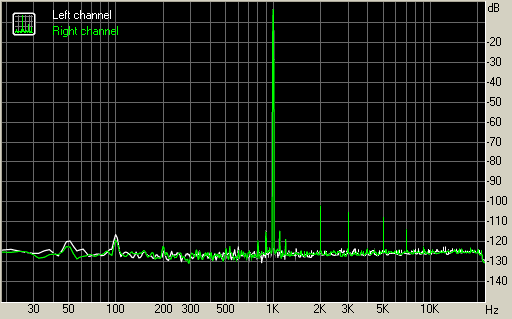
Intermodulation distortion
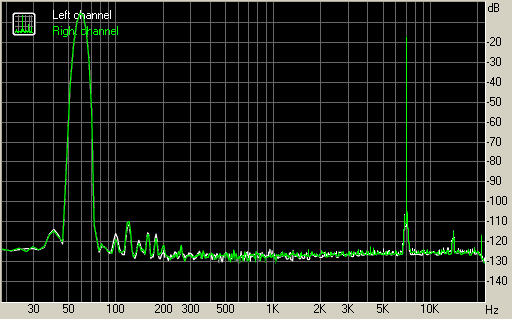
Left |
Right |
|
| IMD + Noise, % | +0.0048 |
+0.0049 |
| IMD + Noise (A-weighted), % | +0.0043 |
+0.0043 |
Stereo crosstalk
Left |
Right |
|
| Crosstalk at 100 Hz, dB | -99 |
-98 |
| Crosstalk at 1000 Hz, dB | -96 |
-97 |
| Crosstalk at 10000 Hz, dB | -92 |
-93 |
IMD (swept tones)
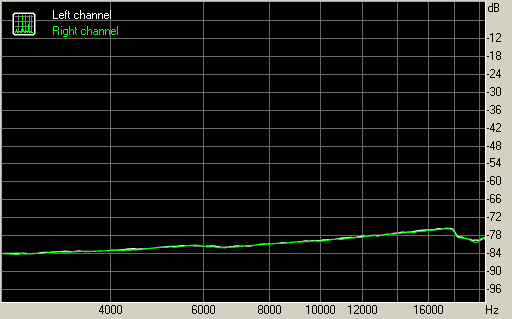
Left |
Right |
|
| IMD + Noise at 5000 Hz, | 0.0081 |
0.0080 |
| IMD + Noise at 10000 Hz, | 0.0105 |
0.0102 |
| IMD + Noise at 15000 Hz, | 0.0148 |
0.0143 |